
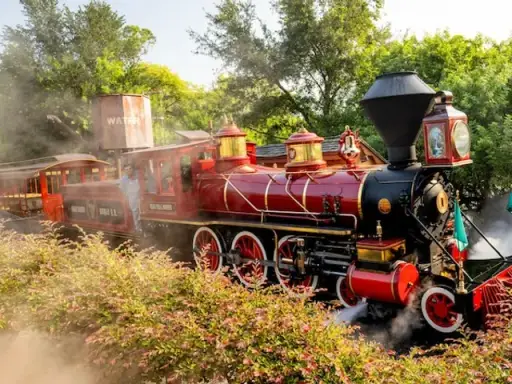

Magic Kingdom on Friday 21 August 2026
Magic Kingdom ran at 23% of a peak day on Friday 21 August 2026 - below avg, the 4th quietest of the 31 days that month. The park-wide average queue was 18 minutes, peaking at 21 around 11am.
Friday 21 August 2026
Magic Kingdom ran at 23% of a peak day, against 46% for August 2026 as a whole. The park-wide average queue was 18 minutes.
Queue times through the day at Magic Kingdom
Park-wide average by hour
8am - 6pm · minutes
The park was at its worst around 11am, averaging 21 minutes, and at its best at 8am with 12 minutes.
Every ride's queue at Magic Kingdom on Fri 21 Aug
Average queue by ride
25 rides · longest first
- TRON Lightcycle / Run49m
- Seven Dwarfs Mine Train42m
- Peter Pan's Flight34m
- Tiana's Bayou Adventure34m
- Big Thunder Mountain Railroad31m
- Buzz Lightyear’s Space Ranger Spin31m
- The Many Adventures of Winnie the Pooh26m
- Jungle Cruise25m
- Space Mountain24m
- Haunted Mansion18m
- Walt Disney World Railroad - Fantasyland15m
- Walt Disney World Railroad - Main Street, U.S.A.15m
- Tomorrowland Speedway11m
- Astro Orbiter10m
- Pirates of the Caribbean10m
- Tomorrowland Transit Authority PeopleMover8m
- "it's a small world"6m
- Mad Tea Party6m
- Prince Charming Regal Carrousel6m
- The Barnstormer6m
- The Magic Carpets of Aladdin6m
- Dumbo the Flying Elephant5m
- Under the Sea - Journey of The Little Mermaid5m
- Main Street Vehicles0m
- Walt Disney's Carousel of Progress0m
TRON Lightcycle / Run held the longest queue, averaging 49 minutes and touching 70. 1 ride was down for most of the day.
When Magic Kingdom rides were down on Fri 21 Aug
Closures through the day
7:30am early entry (shaded) · 8am - 6pm · red is closed
- Walt Disney's Carousel of Progress10h
- Buzz Lightyear’s Space Ranger Spin3h 20m
- Main Street Vehicles3h
- The Many Adventures of Winnie the Pooh2h 27m
- Walt Disney World Railroad - Fantasyland2h
- Walt Disney World Railroad - Main Street, U.S.A.2h
- Seven Dwarfs Mine Train1h 14m
- Tomorrowland Transit Authority PeopleMover1h
- Tiana's Bayou Adventure32m
- Space Mountain23m
- Astro Orbiter21m
- The Barnstormer17m
- Prince Charming Regal Carrousel14m
- Pirates of the Caribbean10m
- Haunted Mansion8m
- TRON Lightcycle / Run1m
- Big Thunder Mountain Railroad1m
- Jungle Cruise1m
- The Magic Carpets of Aladdin1m
19 of 25 rides lost time on Fri 21 Aug, 34 closures totalling 27 ride-hours. Walt Disney's Carousel of Progress lost the most at 10h.
Where Fri 21 Aug sat in August 2026
Crowd score, day by day
31 days · this day marked
At 23% this was the 4th quietest of the 31 days in August 2026, which averaged 46%.
Every figure here was measured on the day: each ride's queue time and open or closed status is recorded every few minutes through Magic Kingdom's own operating hours. The crowd score is relative to this park's own busiest day rather than to other parks. Rides with no queue recorded were either walk-on all day or not reporting.
Frequently asked
How busy was Magic Kingdom on Friday 21 August 2026?
23% of a peak day, which is below avg. The park-wide average wait across 23 rides was 18 minutes, making it the 4th quietest of the 31 days in August 2026.
What was the best time of day to be at Magic Kingdom on that day?
8am, when the park-wide average was 12 minutes, against 21 minutes at the 11am peak. The park was open 8am - 6pm.
Which ride had the longest queue at Magic Kingdom that day?
TRON Lightcycle / Run, averaging 49 minutes and reaching 70 minutes at its worst. The shortest was Walt Disney's Carousel of Progress at 0 minutes.
Were any rides closed at Magic Kingdom on Fri 21 Aug?
1 ride was down for most of the day.
Where do these figures come from?
Every ride's queue time and open or closed status is recorded every few minutes through Magic Kingdom's own operating hours. The figures on this page are what was measured on the day, not a forecast.