

Typical October waits
Know before
you queue.
Live queue times for 110 parks
See how long every queue is right now, and how busy any day of the year will be. We score each day 0 to 100 for how busy the park gets, so you can pick a quiet one.



Alton Towers
- An average October day
- 70% busy
- Longest typical queue, The Smiler
- 52min
- Quietest day left this month
- Tue 6 Oct
Thorpe Park
- An average October day
- 80% busy
- Longest typical queue, Hyperia
- 89min
- Quietest day left this month
- Thu 1 Oct
Europa Park
- An average October day
- 60% busy
- Longest typical queue, Voltron Nevera powered by Rimac
- 43min
- Quietest day left this month
- Thu 1 Oct
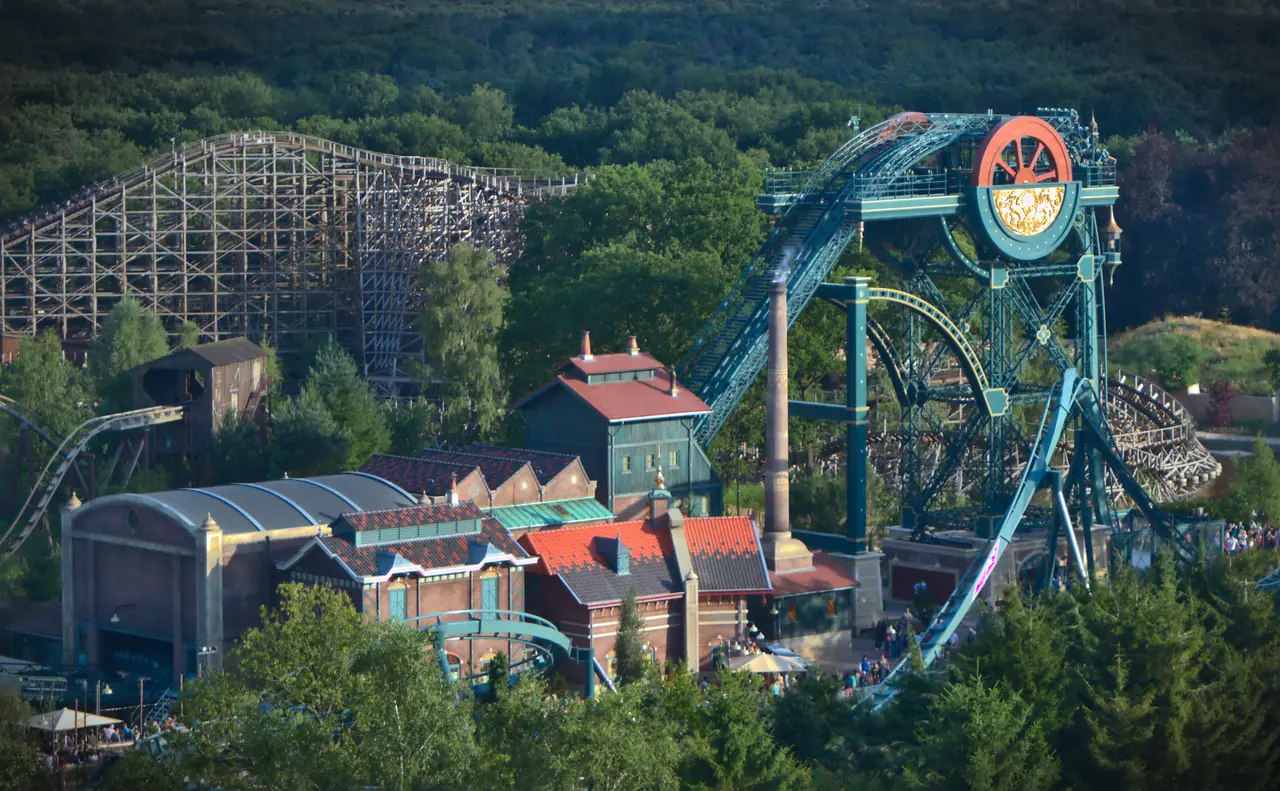
Efteling
- An average October day
- 78% busy
- Longest typical queue, Symbolica
- 33min
- Quietest day left this month
- Thu 1 Oct
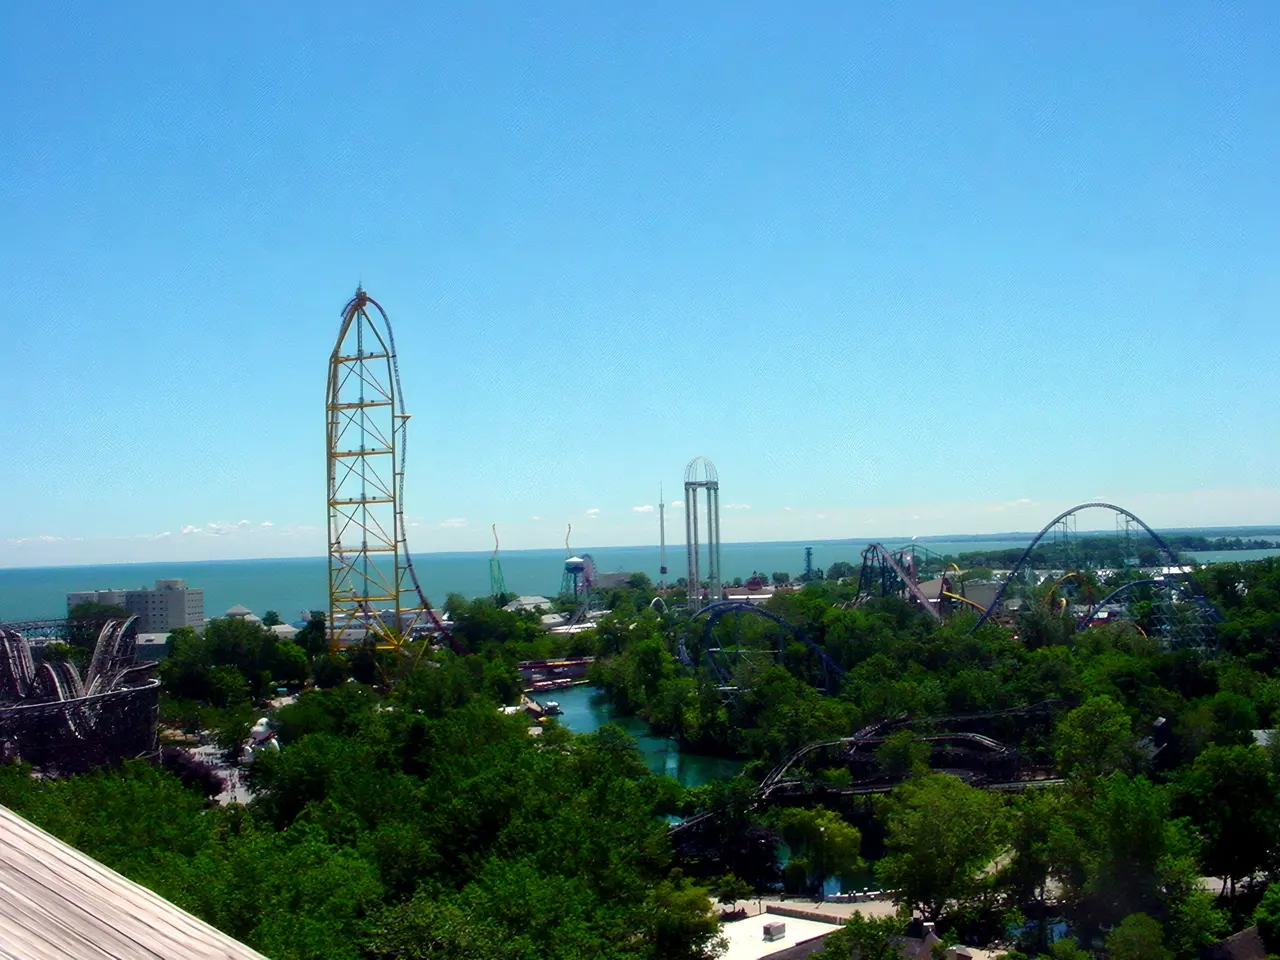
Cedar Point
- An average October day
- 81% busy
- Longest typical queue, Steel Vengeance
- 87min
- Quietest day left this month
- Thu 22 Oct
Every minute we read the queue at every ride in 110 parks. We keep every reading, so each forecast here comes from our own record of how busy each day really was, and every night we check it against what happened.
- Parks tracked, minute by minute
- 110
- Rides with full queue history
- 3.6k+
- Months of crowd forecast, free
- 9
- The whole thing, forever
- £0
Crowd calendar and queue times, at a glance.
How busy Alton Towers will be, how its queues move through the day and which rides actually run. Every figure is from our own readings for October.
How busy it will be.
Today and the week ahead, each scored 0 to 100 against this park's own busiest days.
Pick a quieter day.
The whole month at a glance. Tap a day to see what to expect and how long you would wait.
Queues through the day.
When each ride is at its shortest. Drag across the chart to move through the hours.
Which rides actually run.
How often each ride is open when the park is, and its waits over the last few weeks.
Told when it drops.
Pick a ride and the wait you would accept. One message when it happens, then it stops.
What the score means.
Drag the score and watch the waits change, from an empty park to a packed one.

Theme park wait times
Every park we track.
How busy each one gets on an average day in October, on the same 0 to 100 score.
- Busiest, Universal Epic Universe
- 85% busy
- Quietest, Plopsaland Deutschland
- 9% busy
- Parks with a crowd forecast
- 93
93 parks
- 01Universal Epic UniverseN. America85%
- 02Cedar PointN. America81%
- 03Hollywood StudiosN. America81%
- 04Disneyland ParisEurope80%
- 05Thorpe ParkEurope80%
- 06Shanghai Disneyland ResortOther79%
- 07EftelingEurope78%
- 08Six Flags Over TexasN. America76%
- 09Universal Islands Of AdventureN. America75%
- 10Animal KingdomN. America73%
- 11EpcotN. America72%
- 12Alton TowersEurope70%
- 13Six Flags Great AdventureN. America70%
- 14Universal Studios Florida ParkN. America70%
- 15Disney California AdventureN. America69%
- 16Kings IslandN. America68%
- 17Parc AsterixEurope67%
- 18Walibi HollandEurope67%
- 19Disneyland ParkN. America66%
- 20Six Flags Discovery KingdomN. America66%
- 21Six Flags Great AmericaN. America66%
- 22Port Aventura WorldOther65%
- 23Silver Dollar CityN. America64%
- 24DollywoodN. America63%
- 25Universal Studios HollywoodN. America63%
- 26Canadas WonderlandN. America62%
- 27Magic KingdomN. America62%
- 28Six Flags MexicoN. America61%
- 29Europa ParkEurope60%
- 30Six Flags Fiesta TexasN. America59%
- 31Chimelong Water ParkAsia57%
- 32Legoland WindsorEurope57%
- 33Chessington World Of AdventuresEurope55%
- 34EnergylandiaEurope55%
- 35Legoland CaliforniaN. America54%
- 36Walibi BelgiumEurope54%
- 37Djurs SommerlandEurope53%
- 38LisebergEurope52%
- 39PhantasialandEurope52%
- 40Californias Great AmericaN. America51%
- 41Legoland DeutschlandEurope51%
- 42Movie Park GermanyEurope51%
- 43Parque De Atracciones MadridEurope51%
- 44La Ronde MontrealN. America48%
- 45Seaworld OrlandoN. America48%
- 46BobbejaanlandEurope47%
- 47Knotts Berry FarmN. America46%
- 48Legoland New YorkN. America46%
- 49Six Flags New EnglandN. America46%
- 50Walibi Rhone AlpesEurope46%
- 51HersheyparkN. America44%
- 52MirabilandiaEurope44%
- 53Six Flags Magic MountainN. America44%
- 54BellewaerdeEurope43%
- 55Universal Volcano BayN. America43%
- 56Busch Gardens WilliamsburgN. America42%
- 57CarowindsN. America42%
- 58EverlandAsia42%
- 59Heide ParkEurope42%
- 60Legoland BillundEurope41%
- 61ToverlandEurope41%
- 62GardalandEurope40%
- 63KnoebelsN. America39%
- 64Legoland KoreaAsia39%
- 65Six Flags Over GeorgiaN. America38%
- 66Parque Warner MadridEurope36%
- 67Pleasurewood HillsEurope36%
- 68Blackpool Pleasure BeachEurope34%
- 69Chimelong ParadiseAsia34%
- 70Dorney ParkN. America34%
- 71KennywoodN. America34%
- 72Kings DominionN. America34%
- 73Seaworld San AntonioN. America34%
- 74Legoland OrlandoN. America32%
- 75PlopsalandEurope32%
- 76Tokyo DisneylandAsia32%
- 77Tokyo DisneySeaAsia32%
- 78Legoland JapanAsia31%
- 79Paultons ParkEurope30%
- 80Peppa Pig Park GermanyEurope29%
- 81Sesame Place LanghorneN. America25%
- 82Universal Studios BeijingAsia25%
- 83Busch Gardens TampaN. America24%
- 84Hong Kong DisneylandAsia24%
- 85Seaworld San DiegoN. America24%
- 86Six Flags Frontier CityN. America23%
- 87Chimelong Ocean KingdomAsia22%
- 88Flamingo LandEurope21%
- 89Peppa Pig Theme Park FloridaN. America18%
- 90Caribbean BayAsia15%
- 91Six Flags St LouisN. America15%
- 92Worlds Of FunN. America11%
- 93Plopsaland DeutschlandEurope9%
What is Park Queue Times?
Park Queue Times is a free website that tracks live ride wait times and predicts daily crowd levels for 110 theme parks worldwide, including Alton Towers, Thorpe Park, Walt Disney World, Disneyland Paris, Universal and Europa-Park. Queue times are read from each park's own published feed every few minutes while the park is open, so the number on a ride page is the same number on the board at the entrance.
Those readings are kept day by day, which is what makes the rest of the site possible: an hour-by-hour average for every ride, a reliability score showing how often each ride actually runs, and a crowd calendar that scores each day from 0 to 100 against that park's own busiest recorded day. Forecasts run six weeks ahead and are re-scored against what really happened, and the accuracy is published openly in the almanac.
Everything on the site is free to use with no account required, and the same data is available to developers through a free public API. Park Queue Times is independent and is not affiliated with any theme park or operator.
We would rather say "we don't know" than make a number up.
- NightlyWe mark our own homework
- Every forecast is compared with what actually happened that day, and the model corrects itself overnight. Nobody edits the numbers by hand.
- LowWe say when we're not sure
- A park we've only tracked for a few weeks is labelled like this, on the day itself. We would rather tell you we don't know than make a number up.
- £0Nothing important costs money
- Queue times, calendars and alerts are free and stay free. Plus adds convenience, never access. There is no tier that unlocks the real data.

Go on then. Which park?
Search for yours to see today's queues and the best days to visit.
Make a free account. Your first park day on Plus is on us.
A free account holds 3 alerts, your favourite parks, your coaster count and your saved plans, and comes with one Day pass of Plus to use on the date you choose.